Week 4 - Quasar Reddening & Celestial Projections
Having reproduced the results of the original paper and extending it, for now i'm just looking to learn tricks of the trade - automating tasks like fits file extraction and scatter plots, celestial projections of the objects, learning to make animations using matplotlib and whatnot.


Also, you should refer to the wiki page for Mollweide Projection if you haven't so far. Along with the mollweide projection, there's aitoff, hammer and lambert projections as well which seem to be commonly used for projections of spherical surfaces!
Moving on, if you guys read last week's post, in my analysis of the new data set with ~140,000 quasars, you might notice see vertical features on the color-redshift plots. This represents many-a quasars at roughly the same redshift with varying color values! And it might be interesting to study these quasars specifically as they are outliers - they are reddened! You see, in as Astronomy, the outliers are what make for interesting observations and science!
From observations atleast, these don't seem to be BAL quasars (Broad Absorption Line) whose emissions are intrinsically reddened! But one other interesting thing i noticed about these quasars is their position


Anyway, that's all for now. Maybe i'll find something interesting studying these quasars. Either way, i've learnt quite a few interesting things :D...

A Mollweide projection of 500,000 galaxies observed by the SDSS.

A Mollweide Projection of ~300,000 quasars observed by the SDSS
NOTE : You guys can see that the projection with quasars is a lot more uniform that the projection with galaxies - there are gaps in the filled region i.e dec range +-120:180! This maybe because galaxies can only observed till z<0.5 (maybe, i'll need to verify this). Beyond this point, galaxies aren't spatially resolved anymore and they look the same as stars. Also, beyond this redshift, galaxies become too dim to even be observed, unlike quasars which are extremely luminous! The reason the quasar projection is more uniform (i'm speculating here) is because quasars have been observed till z~10. Quasars are still not spatially resolved and they are visibly no different from stars but if we look at the spectra, you can distinguish a quasar from a star! (or the colors of the quasar, which is what my summer work has been, if you guys followed it)
And because space isn't exactly isotropic, the probability of finding a quasar at a given (ra,dec) is higher than that of finding a galaxy simply because the number of quasars in a given patch of sky is probably higher than the number of galaxies!
Also, apart from the gaps in the filled region, the plot is almost one-sided towards the northern sky because of where the telescope is located. SDSS is carried out using a 2.5m telescope from Apache Point Observatory, Sunspot, New Mexico - which is a latitude of 32 deg N. And the declination range of telescopes usually are +_45 from zenith, which is the projection is one-sided towards the northern sky. The same goes for the gaps in the RA range!
Moving on, if you guys read last week's post, in my analysis of the new data set with ~140,000 quasars, you might notice see vertical features on the color-redshift plots. This represents many-a quasars at roughly the same redshift with varying color values! And it might be interesting to study these quasars specifically as they are outliers - they are reddened! You see, in as Astronomy, the outliers are what make for interesting observations and science!

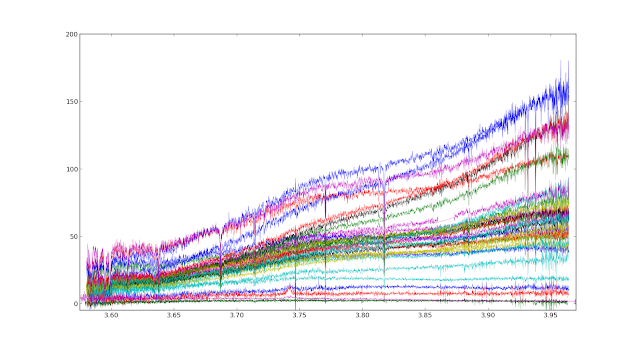
Overlapped spectra of ~25 quasars
From observations atleast, these don't seem to be BAL quasars (Broad Absorption Line) whose emissions are intrinsically reddened! But one other interesting thing i noticed about these quasars is their position

Quasars belonging to the vertical feature at z~1

Quasars belonging to the vertical feature at z~1.6
You can see that (other than for a couple of quasars) there outliers are roughly concentrated in two positions. I don't know what's so special with these positions.
So, that's what happened last week - other than for the fact that i sat through a workshop on social sciences : quant methods and open source tools! I need to learn some stat tools to analyze my data sets and i saw this as a good opportunity! Other than that, i was trying to create an animation to visualize the way colors of a quasar vary with redshift - visualizing section 4.3 from richards et al (99) but well, that hasn't really worked out so far. I'm also working on my project report - while compiling all of the code i've used, the references etc.
Anyway, that's all for now. Maybe i'll find something interesting studying these quasars. Either way, i've learnt quite a few interesting things :D...
