Quasars - An Overview
I promise, this is the last post on quasars. I'll move on after this one!
This post is an attempt to consolidate my summer work and explain it in easier terms - better than how my posts have been so far. So, any comments on the writing style or any questions are welcome.
so, moving on...
What are Quasars?!
Quasars are super massive black holes at the center of galaxies. These black holes are what are called active black holes - they feed on the surrounding gas and dust in the galaxy and emit radiation! You might then ask "Don't all galaxies have black holes at their center?". Damn right, they do. But these are inactive galaxies - because there isn't any (more) free gas lying around for the black hole to feed on. You see, over the course of evolution of a galaxy, gas starts to condense to form stars. So, a very young galaxy with a super massive black hole is what we are calling a Quasar. Quasars are categorized under AGN - Active Galactic Nuclei. The other types of AGN are Type I & II seyfert galaxies, Blazars etc.
Why are Quasars interesting objects to study?!
The strength of the quasar is what makes them interesting to study.
To understand this, let me ask you a question - What galaxies do the stars in our night sky belong to?! The answer to this question is - All of the stars you see belong to the milky way galaxy! You might've heard that the Milky way galaxy is a disk but this disk has a certain width, and because we are in the middle of this disk - we see stars above and below us as well!
Therefore, you can hardly resolve stars from other galaxies - Andromeda is the nearest galaxy and LMC & SMC (Large and Small Magellanic Clouds) are the nearest satellite galaxies and we need huge telescopes to resolve the stars in them! Therefore, stars in galaxies much further can't be resolved! The galaxy itself will look like a blob - technically an extended object. Following the same argument, as you go further away, you will not be able to see galaxies themselves!
And this is where Quasars come in. Because they are so strong, you will be able to see them to further distances than normal galaxies! And because they are so strong - the galaxy's emission will be drowned by the quasar's emission.
How to study Quasars?!
As explained, Quasars are interesting objects to study. So, how does one go about identifying them and studying them in detail?! Two features that can be used to identify Quasars are it's color and it's spectrum. But obtaining a spectrum takes a long time. So, you'd better be sure that this object is a quasar! So, people use the colors of astronomical objects to look for possible quasar candidates and confirm this by spectroscopy!

Telescopes sweep the skies, night after night, digitizing it in the process. Once the sky is digitized, there are automated processes that go about looking for point sources and extended sources in the sky. Once these objects - stars, galaxies, quasars, nebulae and what not - are found, their colors are measured. Once the colors are measured, they are plotted as shown above. If the object colors falls within the red locus - they are quasar candidates. If the object colors fall within the black locus - they are probably just stars! This is one way of selecting potential quasar candidates to study them further!
What have i been working on?!

I'm hoping this gif explains part of what i'm working on.
The black line in the background you see is the spectrum of the quasar - a composite spectrum rather, made by putting together a lot of quasar spectra. The colored curves in the foreground are the transmittance curves of the 5 SDSS filters - u,g,r,i,z respectively. The y axis in the case of the spectrum is the relative flux of the spectrum and the y-axis in the case of the filter response (transmittance) curves is the transmittance.
The spectrum is moving towards the right signifying how the spectrum of a redshifted quasar will look. The spectrum is moving in steps of 0.05 and eventually stops at redshift = 5. Basically, we are looking at quasars further and further away.
And as you can see, there are certain values of redshift where a certain emission line - H lyman alpha, CIII etc either enter a specific filter or leave a specific filter. This will result in a change in the color of the quasar i.e the area under the filter curve. Which is what is plotted here -

As seen, there are certain features on the plots - these ups and downs correspond to the emission lines coming in and leaving filters - as mentioned!
As i mentioned earlier, this is another way to look for potential quasar candidates.
And not just that, this work was extended to estimate the redshift of a quasar using just photometry of the quasar.
And that's the end of the story for now. I can go on but i'd rather end it here. As for further work, i'm trying to replicate the contour plot used to look for quasar candidates and i'm trying to clean the data set i worked on - remove outliers and the like. From now on though, no more lengthy essays on quasars. As promised.
And as always, your comments are highly appreciated :)
This post is an attempt to consolidate my summer work and explain it in easier terms - better than how my posts have been so far. So, any comments on the writing style or any questions are welcome.
so, moving on...
What are Quasars?!
Quasars are super massive black holes at the center of galaxies. These black holes are what are called active black holes - they feed on the surrounding gas and dust in the galaxy and emit radiation! You might then ask "Don't all galaxies have black holes at their center?". Damn right, they do. But these are inactive galaxies - because there isn't any (more) free gas lying around for the black hole to feed on. You see, over the course of evolution of a galaxy, gas starts to condense to form stars. So, a very young galaxy with a super massive black hole is what we are calling a Quasar. Quasars are categorized under AGN - Active Galactic Nuclei. The other types of AGN are Type I & II seyfert galaxies, Blazars etc.
Why are Quasars interesting objects to study?!
The strength of the quasar is what makes them interesting to study.
To understand this, let me ask you a question - What galaxies do the stars in our night sky belong to?! The answer to this question is - All of the stars you see belong to the milky way galaxy! You might've heard that the Milky way galaxy is a disk but this disk has a certain width, and because we are in the middle of this disk - we see stars above and below us as well!
Therefore, you can hardly resolve stars from other galaxies - Andromeda is the nearest galaxy and LMC & SMC (Large and Small Magellanic Clouds) are the nearest satellite galaxies and we need huge telescopes to resolve the stars in them! Therefore, stars in galaxies much further can't be resolved! The galaxy itself will look like a blob - technically an extended object. Following the same argument, as you go further away, you will not be able to see galaxies themselves!
And this is where Quasars come in. Because they are so strong, you will be able to see them to further distances than normal galaxies! And because they are so strong - the galaxy's emission will be drowned by the quasar's emission.
How to study Quasars?!
As explained, Quasars are interesting objects to study. So, how does one go about identifying them and studying them in detail?! Two features that can be used to identify Quasars are it's color and it's spectrum. But obtaining a spectrum takes a long time. So, you'd better be sure that this object is a quasar! So, people use the colors of astronomical objects to look for possible quasar candidates and confirm this by spectroscopy!
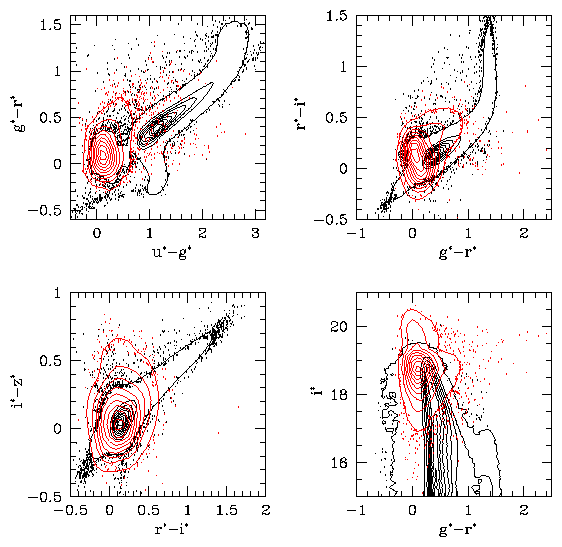
The plots 1,2 & 3 are color vs color. The 4th plot - i* vs g*-r* is magnitude vs color.
Telescopes sweep the skies, night after night, digitizing it in the process. Once the sky is digitized, there are automated processes that go about looking for point sources and extended sources in the sky. Once these objects - stars, galaxies, quasars, nebulae and what not - are found, their colors are measured. Once the colors are measured, they are plotted as shown above. If the object colors falls within the red locus - they are quasar candidates. If the object colors fall within the black locus - they are probably just stars! This is one way of selecting potential quasar candidates to study them further!
What have i been working on?!
I'm hoping this gif explains part of what i'm working on.
The black line in the background you see is the spectrum of the quasar - a composite spectrum rather, made by putting together a lot of quasar spectra. The colored curves in the foreground are the transmittance curves of the 5 SDSS filters - u,g,r,i,z respectively. The y axis in the case of the spectrum is the relative flux of the spectrum and the y-axis in the case of the filter response (transmittance) curves is the transmittance.
The spectrum is moving towards the right signifying how the spectrum of a redshifted quasar will look. The spectrum is moving in steps of 0.05 and eventually stops at redshift = 5. Basically, we are looking at quasars further and further away.
And as you can see, there are certain values of redshift where a certain emission line - H lyman alpha, CIII etc either enter a specific filter or leave a specific filter. This will result in a change in the color of the quasar i.e the area under the filter curve. Which is what is plotted here -

As i mentioned earlier, this is another way to look for potential quasar candidates.
And not just that, this work was extended to estimate the redshift of a quasar using just photometry of the quasar.
And that's the end of the story for now. I can go on but i'd rather end it here. As for further work, i'm trying to replicate the contour plot used to look for quasar candidates and i'm trying to clean the data set i worked on - remove outliers and the like. From now on though, no more lengthy essays on quasars. As promised.
And as always, your comments are highly appreciated :)
