On who's downloading Pandas - Total, monthly and version-specific downloads of Pandas.
For those of you who don't know, Pandas (http://pandas.pydata.org/pandas-docs/stable/) is a data analysis/manipulation library in Python. Most people download it using pip (https://pip.pypa.io/en/stable/) which is the PyPA (Python Packaging Authority) recommended tool for installing Python packages. pip downloads the library from PyPI (https://pypi.python.org/pypi), which is the Python Package Index.
Now, having introduced you to the jargon, let me get to the point. Because most people install Pandas using pip, PyPI has a count on the total number of Pandas downloads. Well, not just Pandas downloads but pretty much every Python library installed using pip. And, you know what, all of the data is available publicly via Google BigQuery (https://bigquery.cloud.google.com/table/the-psf:pypi.downloads).
Think about all the data. Think about all the questions.
For now, I'm going to ask a few questions, specific to the Pandas library.
1. How many people have downloaded any version of the Pandas library over the last month?
2. How many times were each individual versions of the Pandas library downloaded over the last month?
3. How many times was a specific version of the Pandas library, version 0.16.2, downloaded over the last 6 months?
1. How many people have downloaded any version of the Pandas library over the last month?
Which, when run, tells me that the total number of downloads is 640964. Note that this includes all versions of Pandas packages. The query is, in my opinion, pretty self explanatory. We are asking for all downloads from the PSF's* PyPI downloads directory, for the last month, for the project/package Pandas.
* - Python Software Foundation.
2. How many times were each individual versions of the Pandas library downloaded over the last month?
Which, when run, tells me that the most downloaded versions of the Pandas library over the last month are versions 0.19.2, 0.19.1 and 0.18.1 and they were downloaded 227370, 169819 and 83181 times respectively. For those of you who don't know, 0.19.2 is the most recent version of the library. Note that there is a lot of output that I am ignoring here, on number of downloads for other versions.
The complete output can be found at - https://drive.google.com/file/d/0BxwQdgnuTo6JeEZNRExlYktVcjQ/view?usp=sharing
The query has a few extra things, compared to the last one. Specifically, using GROUP BY, we are asking for downloads per version. And we are sorting the resultant table using the total_downloads column, in descending order.
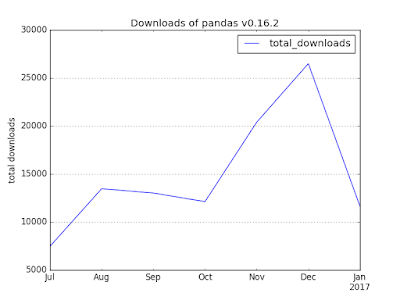
3. How many times was a specific version of the Pandas library, version 0.16.2, downloaded over the last 6 months?
Where we modified the date range to get 6 months worth of data and using WHERE, we specifically query the version 0.16.2 of the Pandas library. You'll also notice the new yyyymm column we have, which we use with GROUP BY to get monthly downloads for the specific version.
The complete output can be found at - https://drive.google.com/file/d/0BxwQdgnuTo6JVFkyc2RRQUZwMXc/view?usp=sharing
And plotting the output, looks like
The plot was made on IPython using the commands
If you are itching for more, there's another blogpost I wrote a month ago on the same topic - https://rahulporuri.blogspot.in/2016/12/pandas-download-statistics-pypi-and.html.
That's it for now. I'll write another post with more questions over the next couple of days.
Until then ...
Now, having introduced you to the jargon, let me get to the point. Because most people install Pandas using pip, PyPI has a count on the total number of Pandas downloads. Well, not just Pandas downloads but pretty much every Python library installed using pip. And, you know what, all of the data is available publicly via Google BigQuery (https://bigquery.cloud.google.com/table/the-psf:pypi.downloads).
Think about all the data. Think about all the questions.
For now, I'm going to ask a few questions, specific to the Pandas library.
1. How many people have downloaded any version of the Pandas library over the last month?
2. How many times were each individual versions of the Pandas library downloaded over the last month?
3. How many times was a specific version of the Pandas library, version 0.16.2, downloaded over the last 6 months?
1. How many people have downloaded any version of the Pandas library over the last month?
SELECT
  COUNT(*) as total_downloads,
FROM
  TABLE_DATE_RANGE(
    [the-psf:pypi.downloads],
    DATE_ADD(CURRENT_TIMESTAMP(), -1, "month"),
    CURRENT_TIMESTAMP()
  )
WHERE
  file.project = 'pandas'
Which, when run, tells me that the total number of downloads is 640964. Note that this includes all versions of Pandas packages. The query is, in my opinion, pretty self explanatory. We are asking for all downloads from the PSF's* PyPI downloads directory, for the last month, for the project/package Pandas.
* - Python Software Foundation.
2. How many times were each individual versions of the Pandas library downloaded over the last month?
SELECT
  file.version,
  COUNT(*) as total_downloads,
FROM
  TABLE_DATE_RANGE(
    [the-psf:pypi.downloads],
    DATE_ADD(CURRENT_TIMESTAMP(), -1, "month"),
    CURRENT_TIMESTAMP()
  )
WHERE
  file.project = 'pandas'
GROUP BY
  file.version
ORDER BY
  total_downloads DESC
Which, when run, tells me that the most downloaded versions of the Pandas library over the last month are versions 0.19.2, 0.19.1 and 0.18.1 and they were downloaded 227370, 169819 and 83181 times respectively. For those of you who don't know, 0.19.2 is the most recent version of the library. Note that there is a lot of output that I am ignoring here, on number of downloads for other versions.
The complete output can be found at - https://drive.google.com/file/d/0BxwQdgnuTo6JeEZNRExlYktVcjQ/view?usp=sharing
The query has a few extra things, compared to the last one. Specifically, using GROUP BY, we are asking for downloads per version. And we are sorting the resultant table using the total_downloads column, in descending order.
3. How many times was a specific version of the Pandas library, version 0.16.2, downloaded over the last 6 months?
SELECT
  STRFTIME_UTC_USEC(timestamp, "%Y-%m") AS yyyymm,
  COUNT(*) as total_downloads,
FROM
  TABLE_DATE_RANGE(
    [the-psf:pypi.downloads],
    DATE_ADD(CURRENT_TIMESTAMP(), -6, "month"),
    CURRENT_TIMESTAMP()
  )
WHERE
  file.project = 'pandas' AND file.version = '0.16.2'
GROUP BY
  yyyymm
ORDER BY
  yyyymm
Where we modified the date range to get 6 months worth of data and using WHERE, we specifically query the version 0.16.2 of the Pandas library. You'll also notice the new yyyymm column we have, which we use with GROUP BY to get monthly downloads for the specific version.
The complete output can be found at - https://drive.google.com/file/d/0BxwQdgnuTo6JVFkyc2RRQUZwMXc/view?usp=sharing
And plotting the output, looks like

The plot was made on IPython using the commands
In [1]: import pandas
In [2]: import matplotlib.pyplot as plt

In [3]: df = pandas.read_table('results-20170113-214245.csv', sep=',')
In [4]: df['yyyymm'] = pandas.to_datetime(df['yyyymm'])
In [5]: df.set_index('yyyymm', inplace=True)

In [6]: df.plot()
Out[6]: <matplotlib.axes._subplots.AxesSubplot at 0x1149a4c90>

In [7]: plt.title("Downloads of pandas v0.16.2")
Out[7]: <matplotlib.text.Text at 0x114a3a850>

In [8]: plt.grid()
In [9]: plt.xlabel("")
Out[9]: <matplotlib.text.Text at 0x1149f7510>

In [10]: plt.ylabel("total downloads")
Out[10]: <matplotlib.text.Text at 0x114a0be50>

In [11]: plt.show()
If you are itching for more, there's another blogpost I wrote a month ago on the same topic - https://rahulporuri.blogspot.in/2016/12/pandas-download-statistics-pypi-and.html.
That's it for now. I'll write another post with more questions over the next couple of days.
Until then ...
