Visualizing the PyPI Pandas download statustics using Tableau - Downloads by location
For some background, read my previous posts on the topic - simple queries to start understanding Pandas downloads (https://rahulporuri.blogspot.in/2017/01/on-whos-downloading-pandas.html), building up queries incrementally to understand Pandas downloads (https://rahulporuri.blogspot.in/2016/12/pandas-download-statistics-pypi-and.html) and using Tableau Public to visualize Pandas downloads by version over the last 6 months (https://rahulporuri.blogspot.in/2017/01/visualizing-pypi-pandas-download.html)
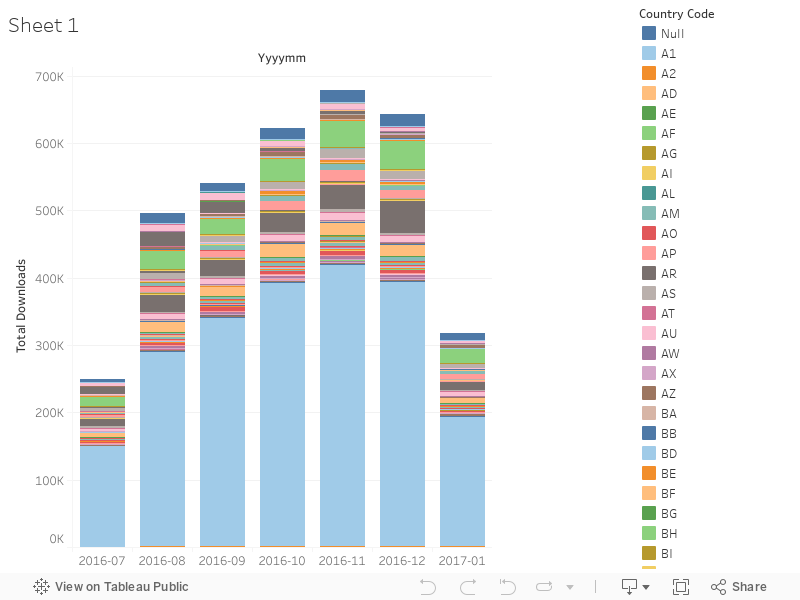
Having visualized the total number of downloads per version per month of Pandas in the last post, we now come to the total number of downloads per month by location.
The relevant query is
and the resultant data can be found at https://drive.google.com/file/d/0BxwQdgnuTo6JNEhqeHZnckpla1U/view?usp=sharing.
I visualized the above dataset using Tableau Public and I ended up with -
Having visualized the total number of downloads per version per month of Pandas in the last post, we now come to the total number of downloads per month by location.
The relevant query is
SELECT
  STRFTIME_UTC_USEC(timestamp, "%Y-%m") AS yyyymm,
  country_code,
  COUNT(*) as total_downloads,
FROM
  TABLE_DATE_RANGE(
    [the-psf:pypi.downloads],
    DATE_ADD(CURRENT_TIMESTAMP(), -6, "month"),
    CURRENT_TIMESTAMP()
  )
WHERE
  file.project = 'pandas'
GROUP BY
  country_code,
  yyyymm
ORDER BY
  total_downloads DESC
and the resultant data can be found at https://drive.google.com/file/d/0BxwQdgnuTo6JNEhqeHZnckpla1U/view?usp=sharing.
I visualized the above dataset using Tableau Public and I ended up with -
